Simo Ylönen, University of Oulu, simo.ylonen@oulu.fi
Collecting hydrological data is hard – Trusting it is even harder.
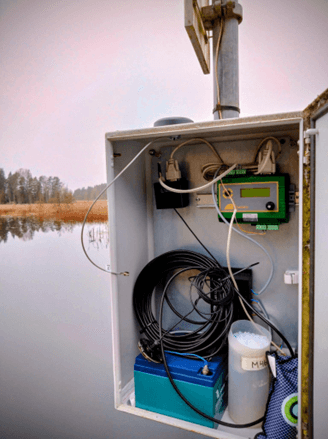
We, researchers, spend a great deal of time collecting, analyzing, and modelling our datasets. Equally, much thought goes into planning the measurements themselves: is this gauging point the right place to represent a given waterbody, how long can the station stay functional without maintenance, and will the data series have gaps? Measuring water levels may look straightforward, but the reality is full of engineering puzzles, machines, and methods. Next time you meet a hydrologist, ask them: “What is your data accuracy, and how do you quantify it?”
Problems with data collection
What are the problems with data collection? Why not just throw dataloggers into the wild and be done with it? – Take land uplift, for example. Levelling helps, but it needs to be repeated every few years. Sensors drift, too. Sudden spikes in the data are easy to catch afterwards, but real-time detection is difficult when thousands of stations send readings every minute of the year. Systematic errors appear as well: most gauging stations are left running unattended, and then nature and time slowly wear down the equipment. Sooner or later, something goes wrong.
The list is long; In practice, almost everything that can go wrong does go wrong at one point or another. So how can we be confident that the data we collect is correct? How can the quality of this massive data stream be assessed accurately? Experts can check it, but that’s tedious and time-consuming. What we need is an automated, preferably real-time system using machine learning. Hydrological time series have recognizable statistical signatures – we should be able to detect when they “look off”.
From frustration to PhD
In my PhD work, I often deal with thousands of gauging stations, each producing data every 15 minutes to 6 hours. After only a few years, that means hundreds of thousands of lines of data. In the case of 15-minute intervals, a large national network like Canada’s produces billions of data points. The idea for my PhD began four years ago, when I was working as a hydrologist and realized that manually checking all this data was hopeless. With some background in machine learning from my university studies, it struck me; I could at least try to automate the task. Methods like TCN (Temporal Convolutional Networks) or LSTMs (Long Short-Term Memory networks) came to mind, but they were too computationally heavy. I couldn’t exactly tell my boss that we should spend tens of thousands of euros on computing power just to test my idea of avoiding boring manual checks.
Still, I found a method and it worked. I could assess whether the collected data was accurate, and with only a single high-end GPU running for two weeks, I had a functioning model. But then another problem appeared. My success depended on hand-picking good predictor variables, guided by domain knowledge and a “gut feeling.” This only worked because I had spent weeks studying a site and visiting it in person. In reality, I had poured weeks into a single station, while my other projects stalled. That made it clear I needed a way to automate “feature engineering” as well.
A poor man’s digital twin
This part took longer. After six months of testing and number-crunching, I developed a baseline algorithm that automatically chooses input points for machine learning models. Each gauging station gets its own “poor man’s digital twin.” I’ve now tested this method on the Canadian, Norwegian, and Finnish hydrological networks, and the results are promising. When I tell colleagues abroad that I can validate data in real time, nationwide, with accuracy down to a few centimeters, they become very interested. I’ve presented the method in Nordic hydrological groups, across the pond, and even within the World Meteorological Organization. The idea is gaining traction.
Looking forward, I plan to test the method on southern hemisphere networks, where data collection is often harder due to connectivity, electricity, financial, or logistical issues. If the approach transfers well, it could have a real global impact.
8.10.2025.