Mariah Josten, University of Turku. mariah.josten@utu.fi
How do we study the impact of ferry traffic on hydrodynamics?
The Finnish Archipelago Sea is the largest archipelago in the world by number of islands and is characterized by dynamic wind-driven currents and a complex bathymetry. Ferries over 200 m in length traverse the Archipelago Sea daily, transporting goods and passengers. While ferry traffic provides important economic and social benefits, these vessels generate wake waves and currents that can potentially impact sensitive marine habitats and species. This highlights the need for field measurements to better understand how ferry traffic affects the movement and behavior of water (i.e., hydrodynamics) in complex environments, such as the Archipelago Sea.
For this purpose, my research aims to:
- Generate high-resolution bathymetric maps of selected field sites. Bathymetric maps enable in-depth analysis of underwater terrain, much like topographic maps do for land surfaces.
- Record time series of flow characteristics at multiple water depths – before, during, and after the ferry passage. The flow characteristics include the speed and direction in which water particles are moving.
- Draw comparisons between these flow conditions at various field sites, taking into account variables such as: distance from the navigational fairway, water depth, seabed slope, wave exposure, wind speed and direction, and the shoreline’s shape and features.
Field sites
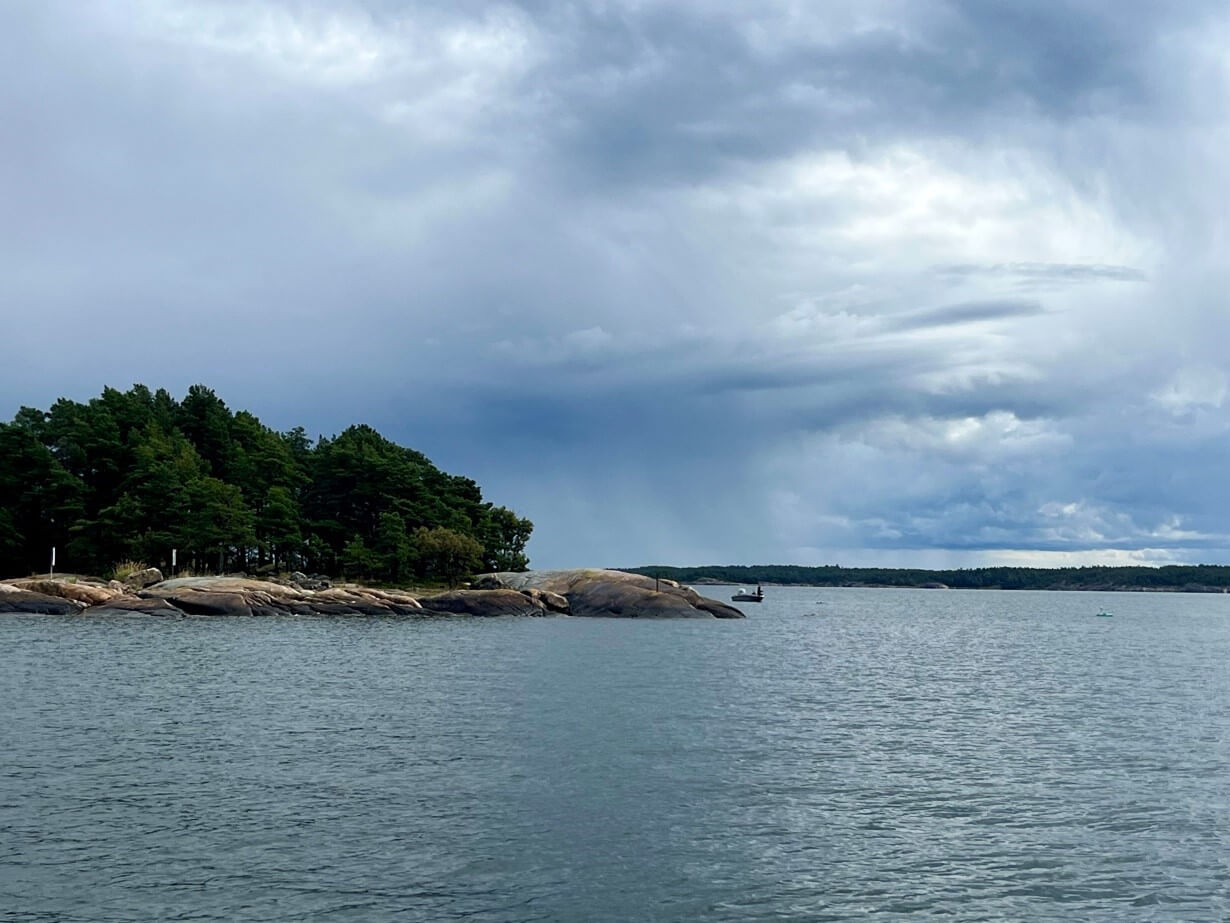
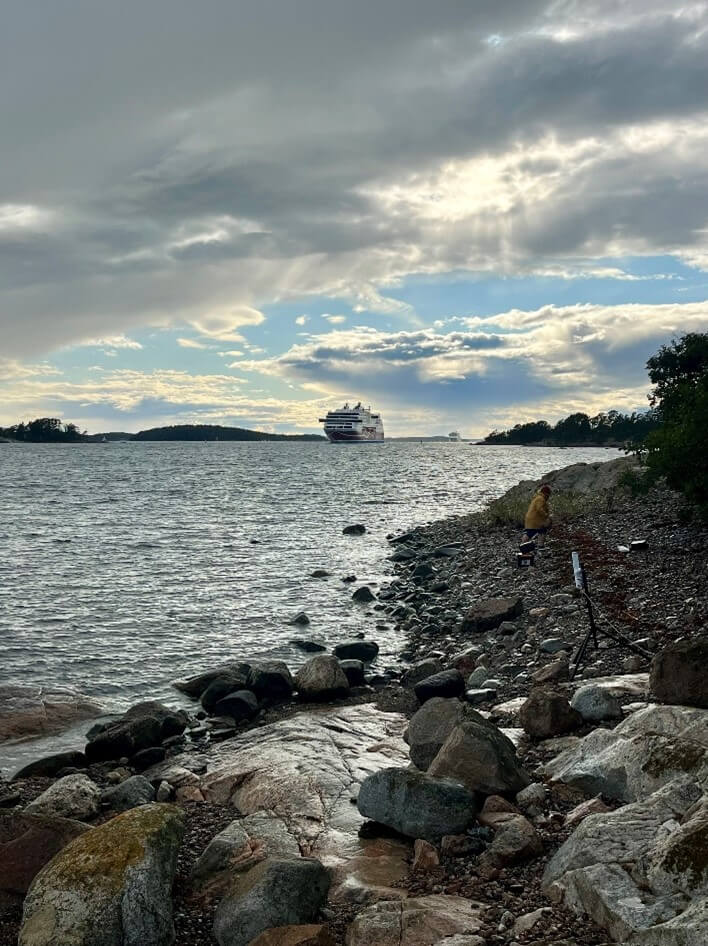
In planning this field campaign, I aimed to compare the flow characteristics at sites located near the navigation fairway used by ferries (from 200 meters to 1 kilometer) with sites positioned farther away (beyond 3 kilometers). There are very few studies focusing on the propagation of ferry-generated wake waves in coastal environments. By analyzing field measurements of flow characteristics, I aim to gain deeper insights into the extent to which wake waves travel in the Archipelago Sea, where islands can obstruct flow and bathymetric features can alter wave behavior. Additionally, I will compare how seabed slope, wind direction, wave exposure, and other variables may influence the flow measurements observed at each site.
Field instruments
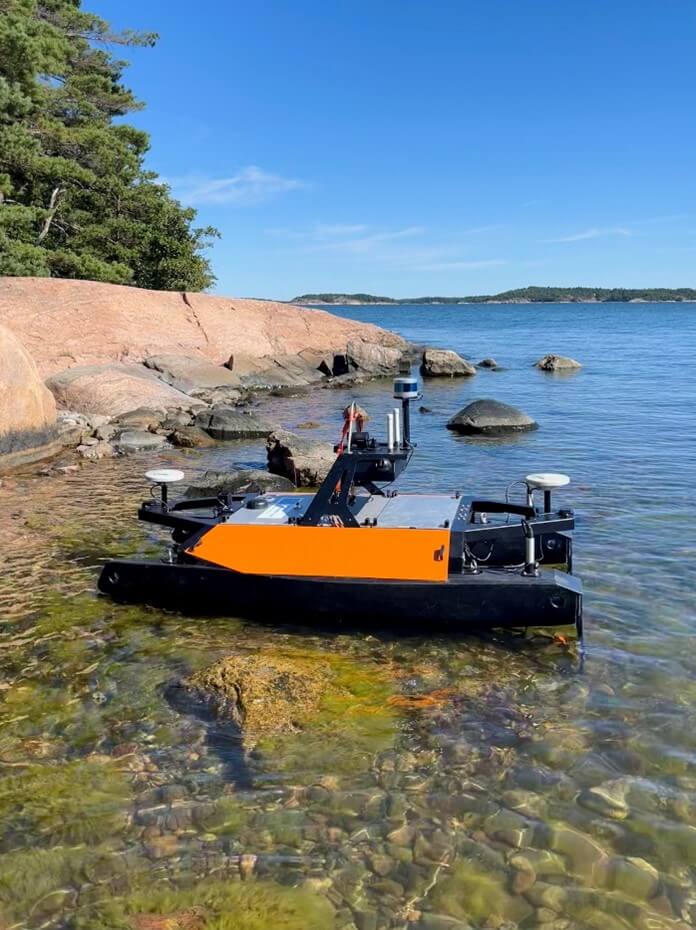
We utilized two types of instruments in this field campaign: multibeam sonar and Acoustic Doppler Current Profilers (ADCP). To create high-resolution bathymetric maps, we employed a multibeam sonar mounted on the ‘Otter,’ our Unmanned Surface Vehicle (USV) that can be operated via computer (Picture 3). This multibeam sonar technology allows for detailed and accurate 3D mapping of underwater terrain by emitting multiple beams of sound waves and analyzing their echoes.
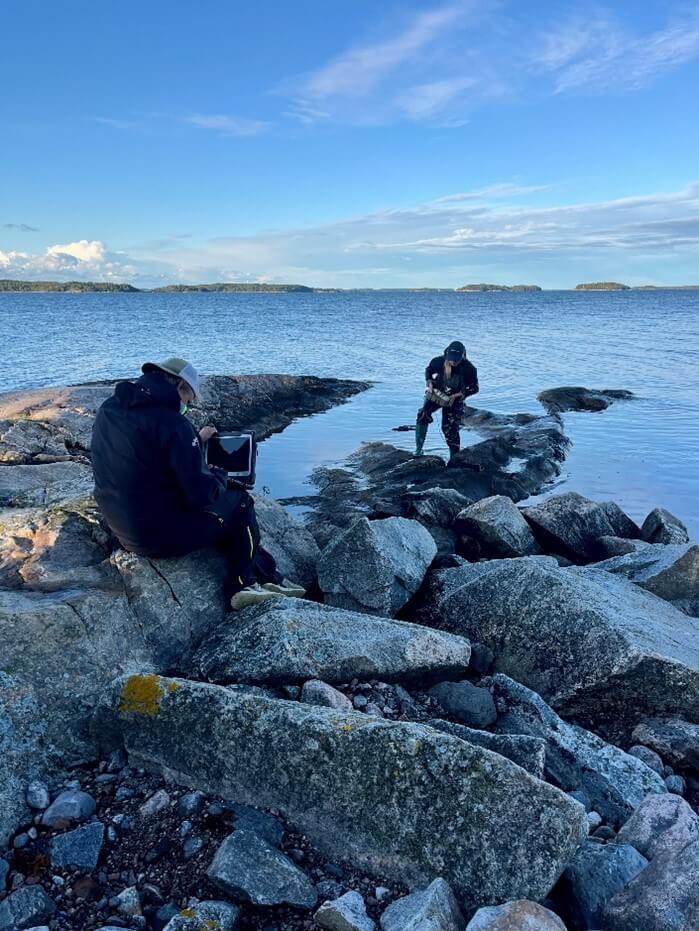
To measure flow characteristics, we deployed ADCP sensors at depths of 1 m, 5 m, and 10 m. The ADCP technology uses sound waves to assess flow speed and direction throughout the water column. The ADCP located at 1 m was placed on the seabed, and Picture 4 shows the retrieval process of this sensor. The ADCPs at 5 m depth were mounted on small floating platforms and anchored in place, while the ADCP at 10 m was attached to the ‘Otter’ and collected data along a transect.
Next steps
After visiting all the field sites, the next steps will involve creating bathymetric maps from the sonar data and processing and cleaning the ADCP data. Additionally, I will gather supplementary information from meteorological stations, which will include data on sea level, wind speed, and wind direction. This will help us better understand how meteorological conditions might be affecting flow measurements. I will also obtain automatic identification system (AIS) data, which provides information about the ferries, including their location, heading, and speed.
6.9.2025.