Mikhail Sandzhiev, University of Eastern Finland, misandzh@uef.fi
Water quality monitoring is essential for protecting ecosystems and human health, though the path from sampling to actionable information is often slow. In this blog, I explore how portable field measurements, automated data processing, and GIS mapping can be combined into a single digital workflow- transforming raw metal concentration data into interactive maps within minutes instead of weeks.
From Numbers to Maps
What if water quality data did not sit in a laboratory report for weeks before anyone could use it? What if metal concentrations measured in the field could appear instantly on a map, ready for interpretation?
Traditional monitoring of metals in surface waters relies on laboratory techniques such as ICP-MS. These methods are precise and reliable, but they require sample transport, preparation, and specialized analysis. The result is often a delay between sampling and usable information. In dynamic aquatic environments, where conditions can vary spatially and temporally, this time gap limits our ability to react quickly. In my doctoral research within the Digital Waters (DIWA) Flagship, I explore how we can shorten that gap by digitalizing the entire workflow – from field measurement to spatial visualization. Instead of separating sampling, analysis, processing, and communication into disconnected steps, we connect them into one continuous system.
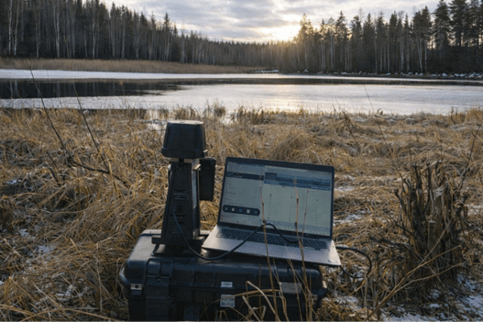
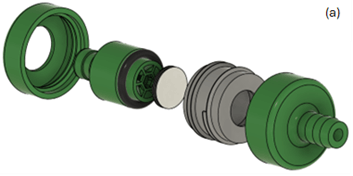
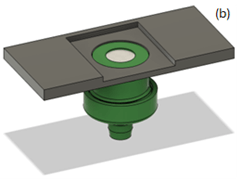
The core of the approach is portable X-ray fluorescence (p-XRF) combined with a metal concentration filter. A water sample is pumped through a small filter that collects dissolved metals. The filter is then analyzed directly on site using a handheld p-XRF instrument. Within minutes, we obtain quantitative information about several metals simultaneously.
However, measurement alone is not enough. Numbers in a spreadsheet do not automatically support environmental decisions. This is where digital processing becomes essential. A custom Python script converts the raw instrument output into structured, georeferenced datasets. The concentrations are automatically processed, validated, and formatted into GIS-compatible files. These files are then imported into QGIS, where each measurement is linked to its geographic location.
To simplify interpretation, we also apply a Water Quality Index (WQI). Instead of examining five separate metal concentrations one by one, the WQI summarizes the overall chemical status into a single value. Importantly, the individual metal concentrations remain accessible in the attribute table for detailed inspection. The map provides an overview; the data remains transparent underneath.
The result is a dynamic map where lakes are symbolized according to their water quality status. By clicking on a lake, the user can instantly view the measured concentrations, the calculated index, and relevant spatial metadata. What previously required laboratory reporting and manual data handling can now be achieved in a fraction of the time.
27.2.2026